The Survey Analysis panel allows you to view and download Raw Data attained from participants' Survey Results. You can find it here: Analysis > Survey Analysis
Data Summary
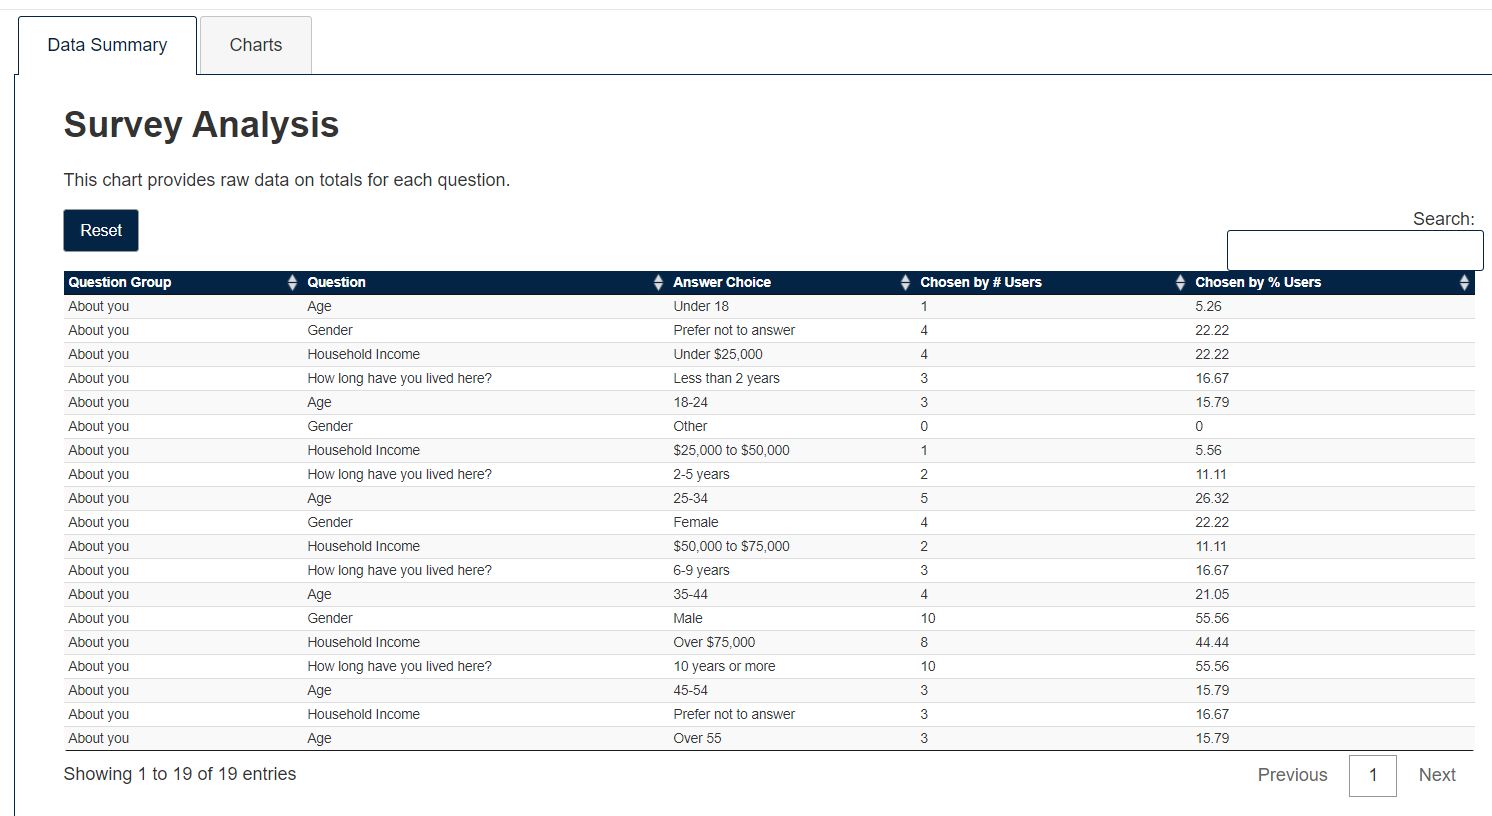
The Data Summary table gives you a snapshot of Survey Results. The data is organized in columns, each representing the relevant Survey categories of the given Ethelo project:
- Question Group: This is the 'Question Category' each Survey question falls in. Each Survey page will correspond to a 'Question Group'.
- Question: This is each individual question in all of the Surveys of your Ethelo project.
- Answer Choice: This is the answer choice for each question.
- Chosen by # of Users: This gives the number of users who selected on a particular 'Answer Choice' of a Question.
- Chosen by % of Users: This gives the percentage of users who selected on a particular 'Answer Choice' of a Question.
Survey Charts
Each Survey (represented as a 'Question Group') in your Ethelo Project can be viewed and downloaded in the form of Graphs. You can download the chart by clicking on the 'Chart context menu' icon on the RHS on the page.
Each Question in your Survey will have its own Graph containing:
- Percentage of participant responses for each answer on the X-axis (find the specific percentage by hovering mouse on each bar)
- Answer Choices on the Y-axis
- Number of participant responses (found beside each bar of the graph)
