
Ethelo Process Stage 3: Results
Ethelo identifies the best decision outcome by examining all the possible combinations of different options. There can be many possible combinations - sometimes millions! Ethelo analyzes these combinations and uses constraints to eliminate any combinations that are not workable. The resulting combinations are called Scenarios.
- Scenarios are combinations of options that obey the constraints
Constraints are rules which determine what options can validly appear together in the same scenario. There are two types of constraints:
- Boolean, which includes logical rules (ex. inconsistent options cannot appear together) and set-based (ex. we can only have one option belonging to a subset of options).
- Calculated, which includes boundaries that apply when the combined attributes of the options in scenario fail to meet a certain condition (ex. the total cost exceeds the budget).
As each participant votes, it gives the Ethelo information it uses score and rank the scenarios. In the right column each participant will see their top scenario, often called “My Top Choice” or "My Results." This is based on how that individual voted and updates in real-time as the participant adjusts the votes and weights - always making sure that the constraints are observed.
Influence
Equality is not always fairness. Sometimes, people are affected differently by decisions, or they may have different rights to participate in the decision-making process because of their pre-existing knowledge or entitlements. In those cases, it is important to enable non-equal distributions of influence. In other cases the problem is the opposite; how to ensure influence is distributed equally among participants, and different groups?
Ethelo allows influence to be allocated with great granularity, and analyses each scenario by measuring how evenly satisfaction would be distributed as a result of the impact of an outcome. Ethelo is able to adjust levels of influence in a given decision process to ensure under-represented groups have similar levels of satisfaction as over-represented groups.
For example, if 20 percent of the participants in an Ethelo decision-making process belong to a minority group, but that minority group comprises 30 percent of the overall population, the influence level of members of that minority group can be adjusted by 1.5 times.
Along the same lines, the Influence level of other participants can also be adjusted to represent their true prevalence in the population, and the non-representative vote sample can be corrected to show representative results.
Group Results
Ethelo aggregates the input from all the participants to generate two kinds of results; Survey Results and Voting Results.
- Survey Results analyzes all the responses to the survey questions and summarizes them in bar or chart graphs.
- Voting Results analyzes all the participant votes and weights and displays the top scenario, along with a graph illustrating the distribution of support and in-depth analysis of each of the options and topics.
In generating the Voting Results, Ethelo evaluations the distribution of support among participants for each option and each potential scenario. As noted above, a “Scenario” is some combination of options that obey the rules, whether that be a budgetary constraint or logical relationships between the options. Ethelo evaluates these scenarios using 4 basic metrics
- Ethelo Score is a measure of the overall strength of the decision, considering how popular it is and how fairly the benefits of the decision will be distributed across the group.
- Support is the average score that everyone has given an option or scenario based on the likert buttons, where “totally oppose” = 0 and “totally support” = 100.
- Approval is the percentage of people who have given an option or scenario a positive likert score rather than a negative or neutral score.
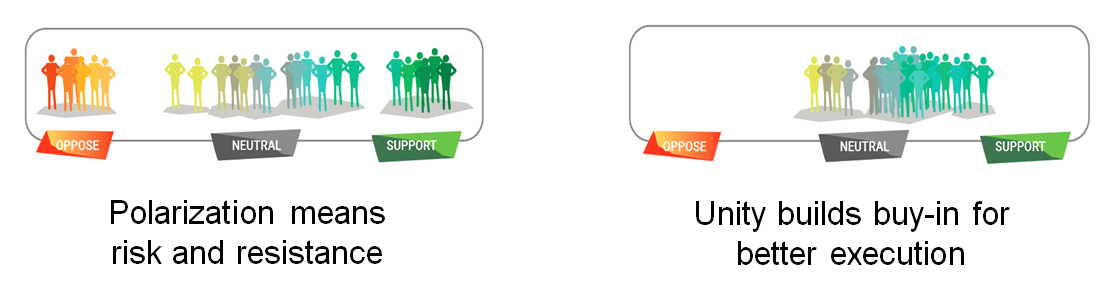
- Conflict is the measure of disagreement or polarization in a group over an option or scenario. Higher conflict scores represent internal resistance and risk of failure.
Understanding Ethelo Score
The option or scenario with the top Ethelo Score will be the one that best minimizes polarization while maximizing support across the group. For example, Ethelo would prefer the support distribution on the right to the one on the left:
Evaluating Scenarios
On the Voting Results page, Ethelo can produce a ranked list showing all the options (“List Mode”), or it can show the top Scenario which is a subset of the options (“Scenario Mode”).
If Scenario Mode is chosen, then the Group Results page will show the highest scoring Scenario, based on the Metric that is chosen. Ethelo Score is the default Metric. Participants can click the Scenario Results panel to see the second, third highest ranking Scenarios, as well as the “worst” Scenario.
- Scenario Result Panel shows the best scenario based on the preferences of all the participants in the group, and updates every 10 minutes.
Along with the specific list of options belonging to the Scenario and the Scenario Characteristics, Ethelo will also display a pie-chart showing the average weight given to each of the topics and/or criteria
Ethelo displays the distribution of support for the best scenario, selected by Ethelo score. The Scenario Panel can be opened, to scroll through and see the 2nd and 3rd scenarios.
Below the Scenario Panel is the list of options that make up that particular scenario. You can click the down arrows to see information about each Option, such as detailed metrics and graphs.
Below the options list, you can see a pie-chart with the average weighting of topics across the group.
Learn More
You can learn more about the Ethelo results generation process by reading Ethelo Results - Deep Dive.